Where Overpaying Your Mortgage Actually Wins; 125 UK Scenarios Analysed
Published May 2026. Original scenario analysis using this site’s Mortgage vs Invest model. The results are examples, not forecasts.
The conventional explanation of "should I overpay my mortgage or invest the spare cash?" often runs along familiar lines: if the expected market return is higher than your mortgage rate, investing may look better; otherwise, overpaying may look better. That is mathematically useful, but incomplete, because it can ignore a major UK-specific variable: which tax wrapper the investing happens through.
We wanted to know how much that matters. So we ran the comparison across 125 realistic UK scenarios; five tax wrappers, five mortgage rates from 3% to 6%, and five investment returns from 4% to 8%; using a standardised household: a £200,000 mortgage, a 25-year remaining term, and £300 a month of spare cash to allocate. This article presents the results.
Across 125 scenarios, investing the spare cash comes out ahead of overpaying the mortgage in 97 (78%). But the size of the difference depends heavily on the tax wrapper; and the gap between the most favourable wrapper in the model (SIPP for a higher-rate taxpayer) and the least favourable (general investment account, same person) is over £60,000 in the same headline scenario.
The setup
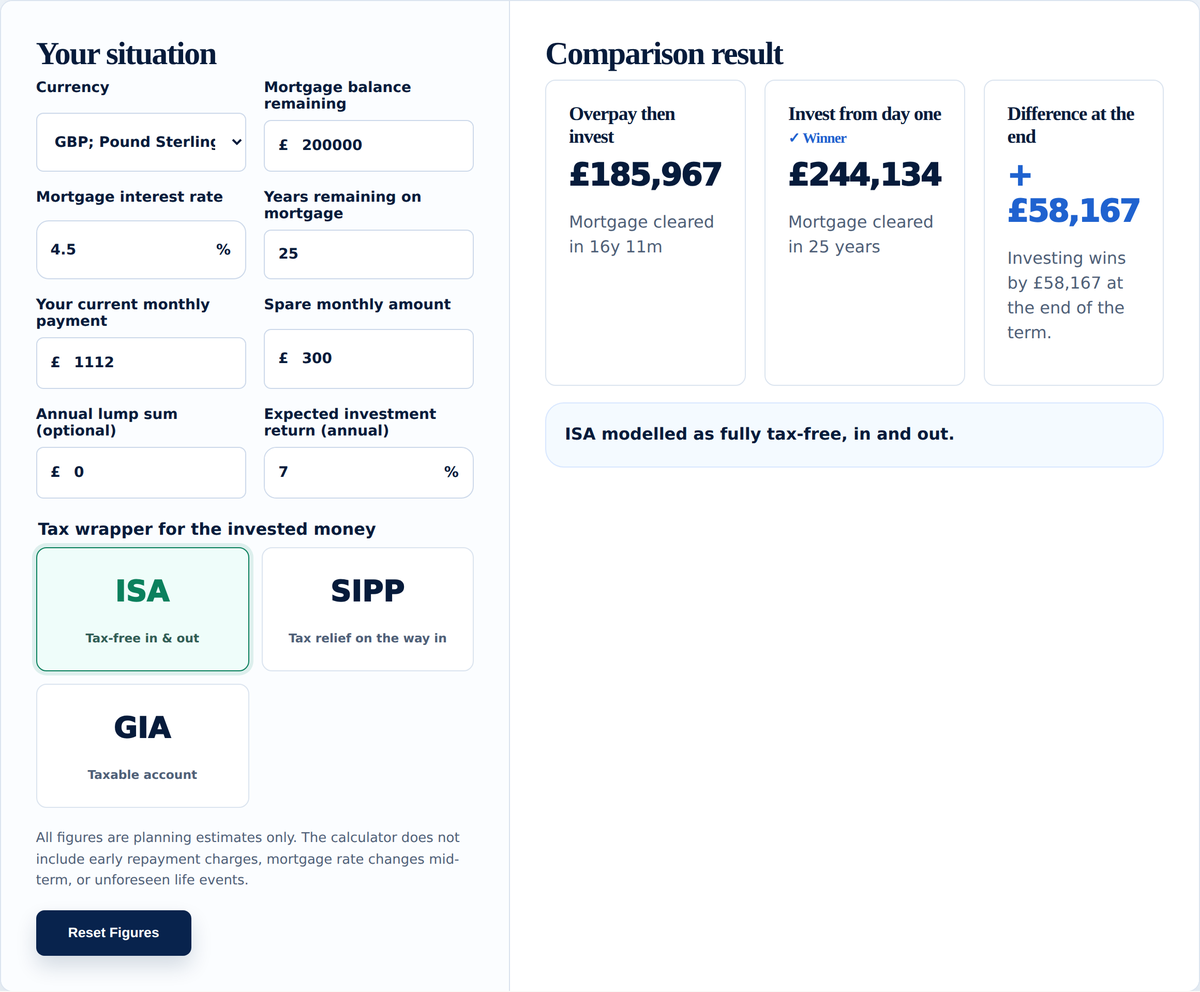
The standardised household has a £200,000 mortgage with 25 years remaining, and £300 a month of spare cash. We compared two paths:
- Overpay then invest: direct the £300/month onto the mortgage, clearing it earlier than the original term, then redirect the freed-up payment plus the spare into investments for the remainder of the original term.
- Invest from day one: pay the mortgage on its contractual schedule, invest the £300/month from the first month, and add the freed-up contractual payment to investments once the mortgage finishes naturally.
Both paths use the same total cash outflow each month over the same 25-year horizon. We computed the final net-of-tax investment value of each, accounting for the tax characteristics of the wrapper chosen. The result we report is the difference: positive means investing comes out ahead in the model, negative means overpaying comes out ahead.
Results: five wrappers, five mortgage rates, five returns
Each cell below shows the difference between paths in thousands of pounds. Blue = investing comes out ahead in the model; green = overpaying comes out ahead.
1. ISA; the baseline case
The ISA case is the cleanest because there's no tax to model on either growth or withdrawal. Whatever ends up in the pot is yours.
| Mortgage rate ↓ / Return → | 4% | 5% | 6% | 7% | 8% |
|---|---|---|---|---|---|
| 3.0% | +£14k | +£33k | +£56k | +£84k | +£119k |
| 4.0% | +£0k | +£18k | +£40k | +£68k | +£102k |
| 4.5% | −£8k | +£9k | +£31k | +£58k | +£92k |
| 5.0% | −£17k | +£0k | +£21k | +£48k | +£81k |
| 6.0% | −£35k | −£19k | +£1k | +£27k | +£59k |
The pattern is the one most articles describe: investing tends to come out ahead where the expected return comfortably exceeds the mortgage rate. The break-even sits roughly where investment return equals mortgage rate, with a small bias toward investing because compounding favours the path that starts contributing immediately. Investing comes out ahead in 21 of 25 cells in the ISA grid.
2. SIPP; basic-rate now, basic-rate in retirement
A typical UK earner who'll stay in the 20% band their whole career. SIPP gets 20% tax relief on contributions (£80 in becomes £100 in pot), but 75% of withdrawals are taxed at 20% in retirement.
| Mortgage rate ↓ / Return → | 4% | 5% | 6% | 7% | 8% |
|---|---|---|---|---|---|
| 3.0% | +£15k | +£35k | +£59k | +£89k | +£127k |
| 4.0% | +£0k | +£19k | +£43k | +£72k | +£109k |
| 4.5% | −£8k | +£10k | +£33k | +£62k | +£98k |
| 5.0% | −£18k | +£0k | +£23k | +£51k | +£86k |
| 6.0% | −£37k | −£20k | +£1k | +£28k | +£62k |
Almost identical to the ISA grid, because when relief in equals tax out, SIPP and ISA produce nearly the same final value. The 25% tax-free lump sum gives SIPP a very slight edge. Investing comes out ahead in 21 of 25 cells, with margins 3-7% larger than the equivalent ISA cell.
3. SIPP; higher-rate now, basic-rate in retirement
This is the headline scenario for UK earners between £50,270 and £100,000 who expect to drop into basic-rate during retirement. The contribution gets 40% relief; the withdrawal is taxed at 20%. That arbitrage compounds for decades.
| Mortgage rate ↓ / Return → | 4% | 5% | 6% | 7% | 8% |
|---|---|---|---|---|---|
| 3.0% | +£20k | +£46k | +£79k | +£119k | +£169k |
| 4.0% | +£0k | +£26k | +£57k | +£96k | +£145k |
| 4.5% | −£11k | +£13k | +£44k | +£82k | +£130k |
| 5.0% | −£23k | +£0k | +£30k | +£68k | +£115k |
| 6.0% | −£49k | −£27k | +£2k | +£38k | +£83k |
The difference becomes much larger. At a 4.5% mortgage and 7% expected return; a plausible UK scenario; investing through a SIPP comes out ahead of overpaying by £82,000, compared to £58,000 in an ISA. The same £300 a month can produce a very different result depending on the wrapper. Investing comes out ahead in 21 of 25 cells, with the average margin roughly 40% larger than the ISA case.
A higher-rate UK taxpayer who is overpaying their mortgage instead of using their SIPP allowance is likely leaving the largest amount of money on the table that the UK tax system permits; short of being in the 60% trap, where the gap is even larger.
4. SIPP; higher-rate now, higher-rate in retirement
Some people will remain in the 40% band in retirement; typically those with large pots, multiple income streams, or working into older age. The relief-in matches tax-out, so the SIPP advantage is smaller than the previous case but still meaningful through the 25% tax-free portion.
| Mortgage rate ↓ / Return → | 4% | 5% | 6% | 7% | 8% |
|---|---|---|---|---|---|
| 3.0% | +£17k | +£38k | +£65k | +£98k | +£139k |
| 4.0% | +£0k | +£21k | +£47k | +£79k | +£119k |
| 4.5% | −£9k | +£11k | +£36k | +£68k | +£107k |
| 5.0% | −£19k | +£0k | +£25k | +£56k | +£95k |
| 6.0% | −£41k | −£22k | +£1k | +£31k | +£68k |
Investing comes out ahead in 21 of 25 cells. Margins fall between the ISA and the 40%→20% SIPP. Worth running specifically because the assumption that your retirement marginal rate matters less than the contribution rate turns out to be wrong; it accounts for roughly half the SIPP advantage in our results.
5. General Investment Account (GIA); the surprise loser
Outside any tax wrapper, investment growth faces dividend tax and capital gains tax. We assumed a 1.5% dividend yield taxed at the higher dividend rate (35.75%), and CGT on gains above the £3,000 annual allowance at the 24% higher-rate CGT rate for 2026/27 higher-rate taxpayers.
| Mortgage rate ↓ / Return → | 4% | 5% | 6% | 7% | 8% |
|---|---|---|---|---|---|
| 3.0% | −£2k | +£10k | +£26k | +£45k | +£69k |
| 4.0% | −£15k | −£3k | +£12k | +£31k | +£54k |
| 4.5% | −£23k | −£11k | +£3k | +£22k | +£45k |
| 5.0% | −£31k | −£20k | −£5k | +£13k | +£35k |
| 6.0% | −£48k | −£38k | −£24k | −£7k | +£15k |
The pattern is markedly different. Investing comes out ahead in only 13 of 25 cells. The tax drag shifts the break-even meaningfully to the right; at a 4.5% mortgage you need 6%+ returns just to break even with overpaying. And at higher mortgage rates, overpaying comes out ahead across the board until returns reach 8%.
This is the result that should make people stop and think. Outside a tax wrapper, investment under-performs the certainty of mortgage interest saved for a substantial chunk of the realistic range. The conventional advice ("invest if returns > mortgage rate") is wrong here unless you mentally add 1-2% to the mortgage rate to account for the drag.
Patterns worth noticing
Pattern 1: Wrapper choice matters more than rate choice
At our central scenario (4.5% mortgage, 7% return, £300/month for 25 years), the difference between wrapper treatments is the largest variable in the model:
- SIPP (40% → 20%): Investing comes out ahead by £82,000
- SIPP (40% → 40%): Investing comes out ahead by £68,000
- SIPP (20% → 20%): Investing comes out ahead by £62,000
- ISA: Investing comes out ahead by £58,000
- GIA (higher-rate): Investing comes out ahead by £22,000
The gap between the most and least favourable wrapper treatments in the same scenario is £60,000; larger than the gap between the same wrapper at 5% return and at 8% return. In this model, the tax wrapper can matter more than small changes in the return assumption.
Pattern 2: SIPP makes the answer robust
For a higher-rate taxpayer using a SIPP, the investing path comes out ahead across 21 of 25 scenarios, and in 14 of those by more than £30,000. The four scenarios where overpaying comes out ahead are all at high mortgage rates (5-6%) combined with low returns (4-5%); combinations that genuinely happened in 2023, but may not be the central assumption for every multi-decade horizon. Even there, the margin is generally below £50,000.
By contrast, the GIA case shifts so much that the conclusion can flip with quite modest changes to assumptions. If you're confident your tax wrapper is a SIPP at higher-rate relief, you can be confident the maths supports investing. If you're stuck with a GIA, you need to be much more careful about the rate-return spread.
Pattern 3: Sequence-of-returns risk is not modelled
One thing the constant-return model can't capture is that real markets don't deliver smooth 7% a year. They deliver -20% one year, +35% the next, and average out to 7% over decades. Path A (overpay then invest) is more exposed to sequence-of-returns risk in its late investing phase, because the contributions are concentrated into a smaller number of years. Path B (invest from day one) is less exposed because it's spreading purchases over the full term.
In practice this argues mildly in favour of Path B (invest from day one) on a risk-adjusted basis, beyond what our deterministic numbers show. We didn't quantify it, but it's a small additional reason not to read the headline grid as definitively pro-overpay even where the smooth-return cells favour it.
Where overpaying comes out ahead in the model
Of the 28 scenarios across all five wrappers where overpaying comes out ahead of investing, all share two features. Mortgage rates of 4% or higher, and investment returns of 5% or lower. The clearest overpayment-favouring cells are:
- 6% mortgage and 4% return in a GIA (40% taxpayer): overpaying is ahead by £48,000
- 5% mortgage and 4% return in a GIA: overpaying is ahead by £31,000
- 6% mortgage and 4% return in an ISA: overpaying is ahead by £35,000
- 6% mortgage and 4% return in a SIPP (40% → 20%): overpaying is ahead by £49,000
The unifying story is straightforward: when borrowing costs comfortably exceed realistic returns, the interest saving from overpayment can come out ahead of the uncertain return on investing, regardless of wrapper. In a world where UK mortgage rates have moved between 2% and 6%+ over recent cycles, this is a band of scenarios people may encounter at some point in a 25-year mortgage life.
What the data doesn't tell you
A few honest caveats. The model uses constant rates and constant returns; in reality both vary. The mortgage rate you pay over 25 years is unlikely to be a single number; your actual experience will be a sequence of fixed deals interspersed with whatever standard variable rate looks like at each transition. The expected investment return is a long-run average that can mask very uncomfortable shorter periods.
The model also doesn't include behaviour: people who plan to invest the difference often end up not, particularly when markets fall. People who overpay typically don't have that failure mode; the cash leaves their account on the mortgage statement whether they feel like investing it or not. If you're honest with yourself about being a less-than-disciplined investor, that's a legitimate reason to weight overpaying more heavily than the maths alone suggests.
Finally, we didn't model early repayment charges, which can be 1-5% above the typical 10% annual overpayment allowance during a fixed period. Many UK mortgage deals allow a limited annual overpayment before early repayment charges apply, often around 10%, but this varies by lender and product. The calculator does not model those charges.
The takeaways
- For many higher-rate taxpayers using a SIPP, investing shows a stronger projected result in this scenario set. The margin at central assumptions is £80,000+ over a typical mortgage life. The result remains favourable across many of the tested rate and return combinations.
- For ISA investors, investing still comes out ahead in many normal rate environments, by perhaps £30-£60k at central assumptions, but the margin narrows quickly as the rate-return spread closes.
- For higher-rate taxpayers using a GIA, the answer is less straightforward. Tax drag reduces some of the investing advantage, and overpaying looks stronger in a meaningful part of the tested range.
- The wrapper choice is more impactful than the rate-return spread for most people. If you're considering overpaying because you don't have ISA room or a SIPP set up, the question to answer first isn't "overpay or invest?"; it's "how do I get money into a tax wrapper?"
- Run your own numbers. The standard household we modelled is not yours. The most useful thing in the calculator is the sensitivity grid: it shows whether your conclusion is robust to small assumption changes, or fragile to them.
Run the numbers for your own situation
The full mortgage-vs-invest comparison tool lets you set your own mortgage balance, rate, term, spare amount, expected return and tax wrapper; and see the sensitivity grid for your specific case.
Open the Mortgage vs Invest CalculatorIf you lean toward investing instead
For the cases where investing comes out ahead, you would hold those investments somewhere, typically a stocks and shares ISA on an investment platform. The Knowledge Hub explains how to choose an ISA platform.
This article is for general information only. It is not financial advice, mortgage advice, investment advice or a personal recommendation. The examples are here to help you compare the trade-offs, but they cannot tell you whether overpaying, investing or doing both is right for your circumstances.
Mortgage overpayments may reduce flexibility, and investments involve risk. The value of investments and any income from them can go down as well as up. You may get back less than you put in, and past performance is not a guide to future returns.